LogoLogo
  • Welcome
  • Overview
    • Architecture
      • API Server
      • Sizing
    • Dashboard Overview
    • Monitoring Concepts
      • Application Performance Management
        • Availability Monitoring
        • Performance Intelligence
        • Service Level Management
        • Synthetic Transaction Management
        • Alerts Management
        • Reporting & Analytics
      • Infrastructure Monitoring
      • Unified Monitoring
    • Automation Concepts
      • Definition of Terms
      • Infrastructure as Code
        • Project Structure and Organization
        • Setting Up IaC Environment
        • Infrastructure Provisioning
        • Configuration Management
      • SAP Basis Automation
      • Automated Migration
  • User Guide
    • Onboarding
    • Setup
      • Gateway Setup
        • Gateway Network Setup
        • IT-Conductor Gateway Setup on Windows
        • IT-Conductor Gateway Setup on Linux
        • IT-Conductor Gateway Setup on AWS
        • IT-Conductor Gateway Setup on Azure
        • IT-Conductor Gateway Setup for SAP Secure Network Communications (SNC)
      • API Server Setup
      • MSP Tenant Setup
      • SSO Setup
        • Azure ADFS Identity Provider
        • Azure Active Directory (AAD) App Gallery
    • Monitoring
      • General
        • Maintenance Mode
          • Manual Maintenance
          • Scheduled Maintenance
        • Central Syslog Server Monitoring
        • URL Monitoring Locations
      • Cloud Monitoring
        • AWS Monitoring
        • Microsoft Azure Monitoring
      • Database Monitoring
        • IBM DB2 Database Monitoring
        • Microsoft SQL Server Monitoring
        • Oracle Database Monitoring
        • SAP HANA System Monitoring
          • SAP HANA Scale-Out Monitoring
          • SAP HANA Overview Dashboard
          • SAP HANA Alert Management
        • SAP ASE Database Monitoring
        • SAP MaxDB Monitoring
        • HA/DR Monitoring
      • Infrastructure Monitoring
        • File Server Monitoring
          • File Watcher Monitoring
        • Git Server
        • OS Monitoring
          • Unix/Linux System Monitoring
            • Linux Network Interface Monitoring
            • OS Printer Monitoring
          • Windows System Monitoring
            • WinRM Adapter Configuration
              • WinRM Services Configuration
              • Domain User Access
              • WMI Namespace Access
              • Windows Service Configuration
        • VMWare vCenter Monitoring
      • SAP Monitoring
        • Business Process Monitoring
          • Business Process Composer
          • BDoc Monitoring
          • IDoc Monitoring
        • SAP BusinessObjects Monitoring
          • SAP BO Data Services Monitoring
        • SAP Cloud Connector Monitoring
        • SAP Host Agent Monitoring
        • SAP NetWeaver Monitoring
          • SAP ABAP System Monitoring
            • SAP Transports
            • Security Role Import
            • SAP ABAP Overview Dashboard
            • SAP CCMS Alert Monitoring
            • SAP Batch Jobs Monitoring
              • SAP Batch Job Monitoring for CCMS Alerts
              • Advanced SAP Batch Job Monitoring
            • SAP SLT & RFC Connection Monitoring
            • Print Spooler Monitoring
            • Workload Monitoring
              • Transaction Code Monitoring
              • SAP Workload Monitoring
          • SAP J2EE System Monitoring
            • SAP J2EE Monitoring Role
            • Keystore Views and Certificates Monitoring
            • SAP PO Application Monitoring
          • SAP Systems Administrator Panel
        • SAP Web Dispatcher Monitoring
        • LMDB Discovery
        • Team-Based Central SAP Download Manager
    • Automation
      • Migration
        • Oracle to AWS Migration
        • Oracle to ASE Migration
        • SAP on MSSQL to AWS Migration
        • S/4HANA to Cloud Migration
      • E2E System Refresh Automation
        • Frequently Asked Questions
      • Age-based HANA Backup Automation
      • Inbound/Outbound Queue Restart Automation
      • OS File System Cleanup Automation
      • OS Linux Pacemaker Cluster Error Management
      • OS Printer Queue Restart Automation
      • OS Linux Kernel Patching using ChAI
      • OS Linux System Reboot using ChAI
      • SAP Batch Job Restart on Error
      • SAP Kernel Update using ChAI
      • SAP HANA Account Activation using ChAI
      • SAP Transports using ChAI
        • Frequently Asked Questions
      • SAP User Unlock and Password Reset Automation
      • Start/Stop Automation
    • Reporting
      • Available Reports
      • Creating Reports
        • Service Health KPI Report
      • Scheduling Reports
        • Automated HANA Reports
      • Report Elements
      • Archived Alerts Reporting
    • Account Administration
      • Invite Users
      • Create Robot Users
      • Update Linux System Account Password After Expiration
    • Notifications
      • Alerts
      • Threshold Overrides
        • Threshold Overrides Variables
      • Notification Targets
      • Distribution Lists
      • Subscriptions
      • Custom SMTP Notification Providers
      • Integration Providers
        • Derdack EA Integration
        • ilert Integration
        • Jira Service Desk Integration
        • Microsoft Teams Integration
        • PagerDuty Integration
        • Slack Integration
      • On-Call Scheduling
      • Calendar Events
    • Diagnostics
      • Gateway Communication Dump Debug Mode
      • Running IT-Conductor Gateway from CLI
      • SAP CCMS Missing Data
    • IT-Conductor FLUX
    • SID-Refresh
      • Product Overview
      • Getting Started
      • Documentation
      • Release Notes
      • Frequently Asked Questions
      • Troubleshooting Guide
        • Component CRM_MIDDLEWA_CRM - CRM Middleware Configuration
        • Failure to Start the Java-based GUI
        • Inconsistencies found in the table TADIR
        • Java-based GUI Runs with Pixelated Fonts
        • No email message is created after sending an email in SO01
        • Program Run as root
        • SICF Wrong Credentials
        • SU01: Error in user management
        • External Resources
      • Pricing
  • Release Notes
    • Gateway
  • References
    • Open-Source Software
    • Support
Powered by GitBook
On this page
  • Configure Extended Network Interface in IT-Conductor
  • Configure Remote Host Ping Monitoring in IT-Conductor
  1. User Guide
  2. Monitoring
  3. Infrastructure Monitoring
  4. OS Monitoring
  5. Unix/Linux System Monitoring

Linux Network Interface Monitoring

PreviousUnix/Linux System MonitoringNextOS Printer Monitoring

Last updated 10 months ago

Network interface monitoring in Linux involves tracking and managing individual network interfaces within Linux-based systems. By continuously monitoring network interfaces on Linux systems, administrators can track bandwidth usage, optimize resource allocation, detect network errors or congestions, and troubleshoot connectivity issues that may impact system performance and reliability.

Monitoring network interfaces in IT-Conductor enables real-time visibility into network interface status, errors, throughput, remote host ping statistics, etc. It allows the identification of networking issues without full-fledged network monitoring infrastructure.

To view the Linux network interface metrics, locate the Network Interfaces node in the Linux Systems grid.

Note: Only interface status, IP addresses, and other details are initially pulled.

Configure Extended Network Interface in IT-Conductor

If required, IT-Conductor can utilize the ifstat command to collect other network interface metrics. To enable this feature, follow the instructions below.

  1. Click Configuration in the Network Interfaces grid.

Note: The newly collected metrics will appear in the service grid within 5-15 minutes.

  1. Verify if the newly collected metrics are showing properly in the Network Interfaces grid.

Network Interfaces Extended Metrics

  • State - refers to the current operational state of the network interface.

  • RX Data - refers to the amount of data received (in bytes) by the network interface.

  • RX Dropped - refers to the number of incoming packets dropped by the network interface due to issues like buffer overflows or congestion.

  • TX Data - refers to the amount of data transmitted (in bytes) by the network interface.

  • TX Dropped - refers to the number of outgoing packets dropped by the network interface, typically due to congestion or other network issues.

  • TX Errors - represents the number of transmission errors encountered by the network interface, which could include issues like collisions or failed transmissions.

Configure Remote Host Ping Monitoring in IT-Conductor

Host ping is deactivated by default.

Activate Host Ping

To activate host ping, follow the instructions below.

  1. Click Properties in the Linux System grid.

  2. Check the Network Ping Monitoring option, and then click Save.

  1. Verify if the Host Ping node shows in the Linux System grid.

Configure Individual Host Ping

To set up individual host ping, follow the instructions below.

  1. Click Configuration in the Host Ping grid.

  1. Fill out all the necessary information in the Create Host Ping Retriever configuration page. Once completed, click Finish to add the system.

Note:

  • Specify a proper name and host(s). Multiple hosts should be separated by spaces.

  • You can override the default Linux ping command parameters: Interval, Packets, & Timeout.

  1. Verify if the newly collected metrics are showing properly in the Host Ping grid.

Host Ping Key Metrics

  • Packet Loss - refers to the percentage of packets that fail to reach their destination over a network interface. It aggregates all ping result records and alerts on each host that has a loss value above the threshold.

  • Response Time - refers to the time it takes for a packet to travel from its source to its destination and back.

  1. Verify the additional Response Time monitor in the Host Ping grid.

View Historical Ping Results

To view historical ping results, navigate to the Packet Loss explorer and click on any data point (green circle) on the chart line to display the ping result records for the interval selected.

Note: The same approach can be applied to Response Time monitors.

View Historical Response Time

To view historical response time, navigate to the specific host's Response Time explorer and click on any data point (green circle) on the chart line to display the response time records for the interval selected.

Click to activate the IFStat retriever.

Note: The thresholds can be set up for all monitors. See for more information.

Click to add a new ping.

To the effective thresholds, click. Adjust the values and alerting as required.

Creating Threshold Overrides
Figure 1: Linux System Grid
Figure 2: Configuration Tool in Network Interfaces Grid (Basic Metrics)
Figure 3a: Linux Network Interfaces Configuration Actions Panel Page (Inactive)
Figure 3b: Linux Network Interfaces Configuration Actions Panel Page (Initial)
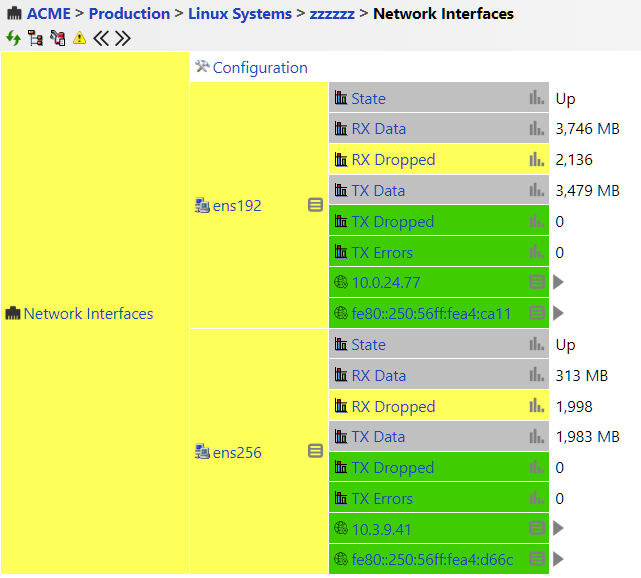
Figure 4: Network Interfaces Grid (Extended Metrics)
Figure 5: Network Ping Monitoring Option in Linux System Properties
Figure 6: Host Ping Grid
Figure 7: Host Ping Configuration Actions Panel Page
Figure 8: Create Host Ping Retriever Configuration Page
Figure 9: Host Ping Grid (Extended Metrics)
Figure 10: Packet Loss Monitoring
Figure 11: Reported Packet Loss
Figure 12: Packet Loss Overrides
Figure 13: Response Time Monitoring