Transaction Code Monitoring
Last updated
Last updated
Due to performance overhead and limited use, we transitioned workload monitoring from wholesale to custom configurations. Here are the instructions on how to add single TCODE monitoring.
Workload Statistics are not collected for all TCODEs anymore; to collect specific TCODE stats, you need to explicitly configure a retriever (or create a dedicated retriever).
Navigate to the system of interest in the grid, and click Retriever tool/leaf.
An inactive retriever, Stats Summary Retriever, is always created. For easy maintenance, make a copy for each type as needed:
For TCODEs selection
For TaskType (and TCODEs) selection
For User (and TCODEs) selection
Any combination of custom selector
Please be advised that a single retriever's Gateway/SAP overhead is repeated for each additional one. Stats Summary retriever always pulls/summarizes all STAT records for the interval; the On-Gateway retriever will enumerate all records returned from SAP and match them to the selector; only matching records will be posted to IT-Conductor. Busy SAP systems have thousands of STATS records per interval (normally 15 min), which will create a significant overhead, so try to consolidate these retrievers as much as possible.
Add/Modify the Insertion Criteria records; the drop-downs will suggest the values.
You usually focus on:
SAPDialogStep.TASKTYPE
SAPDialogStep.TCODE
SAPDialogStep.TERMINALID
SAPDialogStep.ACCOUNT
All Insertion criteria work on an “AND” basis.
Use Exclusion criteria if needed, which will be applied after the Insertion Criteria so you can filter out undesired records.
Modify the Read Interval if needed (default 15 min). This interval is for calculating the summary records and calculating the repeat executions of the retriever.
If you set the interval to 30 minutes, then 30 min average records for each TCODE/TASKTYPE/ACCOUNT/TERMINAL/TimeStamp combination will be created; you will not be able to zoom in time-wise below that. If you change it afterward, you will need to update the associated aggregators, or the end data will not be accurate.
After the STAT Record objects (class SAPServiceAggregatorSTATSummaryTCODE) are created in IT-Conductor you need to configure the aggregation/threshold to make sense of the interval data. The individual TCODE Aggregators (SAPServiceAggregatorSTATSummaryTCODE) are automatically created (currently, the template is disabled for an overhead reason) however, you will need to configure manually the so-called Buckets (aka consolidators) that consolidate individual aggregator data into bucket data.
You can either create a new consolidator manually or add “source” to an existing consolidator. The “source” is a setup that defines the criteria for the inclusion of aggregators into the bucket. If you only need to monitor a single “standalone” TCODE you don't need a consolidator.
The Threshold (monitor) is auto-created for Consolidator. But for individual (standalone) TCODE aggregators, you will need to create one manually.
Create a threshold override for Target Class=ConsolidatorSAPStats.
An alternative, more modern, and efficient way to aggregate the data is to use Threshold Collector (SAPStatSummaryThresholdCollection). Threshold Collector combines data record aggregation and value monitoring in one.
Modify an existing one to include more TCODEs or create a new one.
Select Value Attribute to form the drop-down menu (default - SAPDialogStep.RESPTI).
Select Application (SAP NW) from the drop-down menu (Optional).
Type in the SAP Account (Optional).
Type in TCODE Regex (any valid regex expression, case sensitive, use (?i) to turn off case sensitivity).
Type in Task Type list (comma-separated, optional, use Task-Type Field Definition for numeric task type values).
Important: Ensure you create objects when impersonating the tenant’s user or select the proper tenant owner if you are IT-Conductor administrator.
Upon creating the "Threshold Collector", a new Workload container will be created (if it doesn’t exist) and discovered under the SAP Grid; the threshold will also appear.
Note: We recommend creating "Threshold Collector" instead of old-style Consolidators, but if you need Bucket support with drill-down functionality (into individual TCODEs), the Consolidators are the way to go.
Create a threshold override for Target Class=SAPStatSummaryTCODE.
In SAP systems, long-running transactions refer to business processes or activities that take a significant amount of time to complete. These transactions can have an impact on system performance and overall efficiency. If your SAP system is experiencing performance degradation, it may be due to the long-running job execution time that is caused by an expensive SQL statement. Other causes and side effects of long-running transactions can also show up in areas like waits, blocking, locks, memory bottlenecks, high process, and CPU utilization, and timeouts.
Getting started with monitoring expensive and long SAP SQL Statements is as simple as defining the recovery activity within the background job threshold override.
Navigate to the IT-Conductor main menu → Support → Downloads and download and import the following IT-Conductor SAP Transport Modules into the target SAP System (v6.76.1 IT-Conductor Function Module MS1K900554)
This will enable batch job monitoring in your SAP system. When the runtime threshold is reached, it will display the ABAP SQL Statement that is currently being executed.
After importing the transport, you must define the recovery activity for the job you want to monitor. In this case, let’s define a recovery activity for a background job.
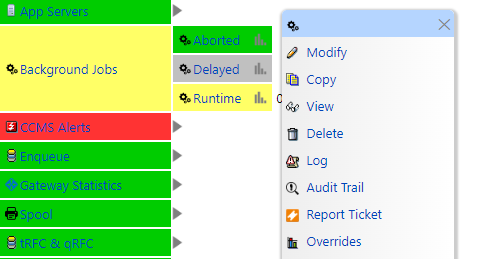
Navigate to Target System → Background jobs, then click on the Runtime gear icon → Override.
You may choose to create an override from zero or create an override from a template.
Give the override a descriptive name.
On the object criteria, fill out the following fields:
Elapsed Time
Target System (SID)
Job Name you wish to track
Owner of the job
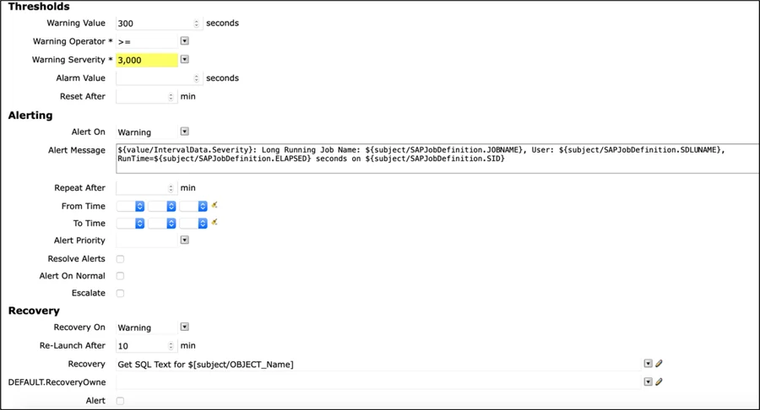
Set the threshold values and the alert message that will be displayed whenever the job elapsed time goes over the defined threshold. The message will display the objects selected in the object criteria section.
Under the Recovery section, click on the drop-down arrow for recovery activities and select the predefined recovery activity for background jobs.
Click on the Save icon.
A recovery action activity will also be triggered when an alert is generated for a long-running job.
You may also track the time in which a background activity exceeds the previously established elapsed time.
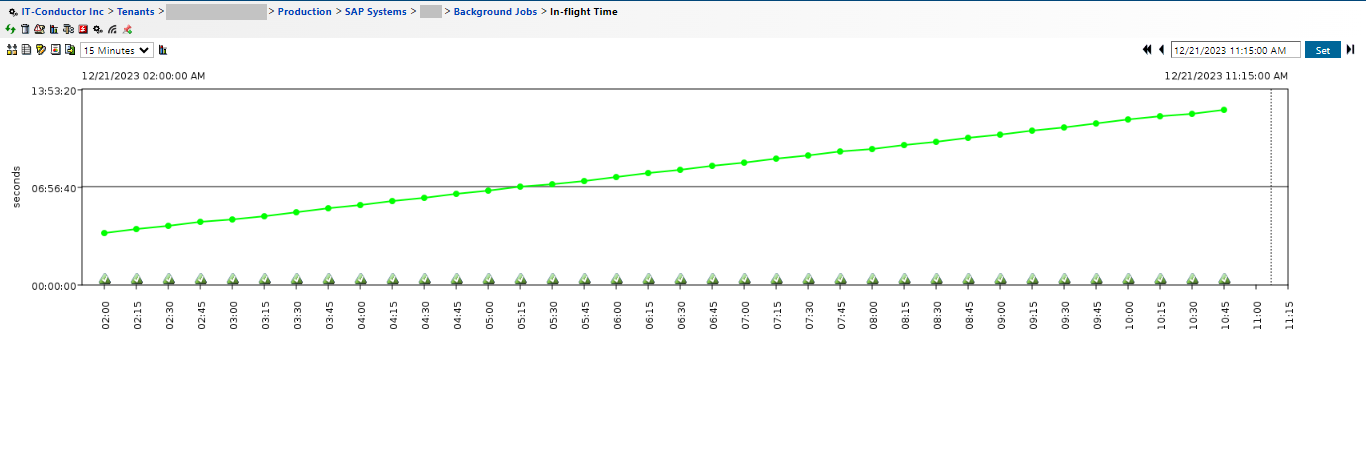
Navigate to Target System → Background jobs → In-Flight Time.
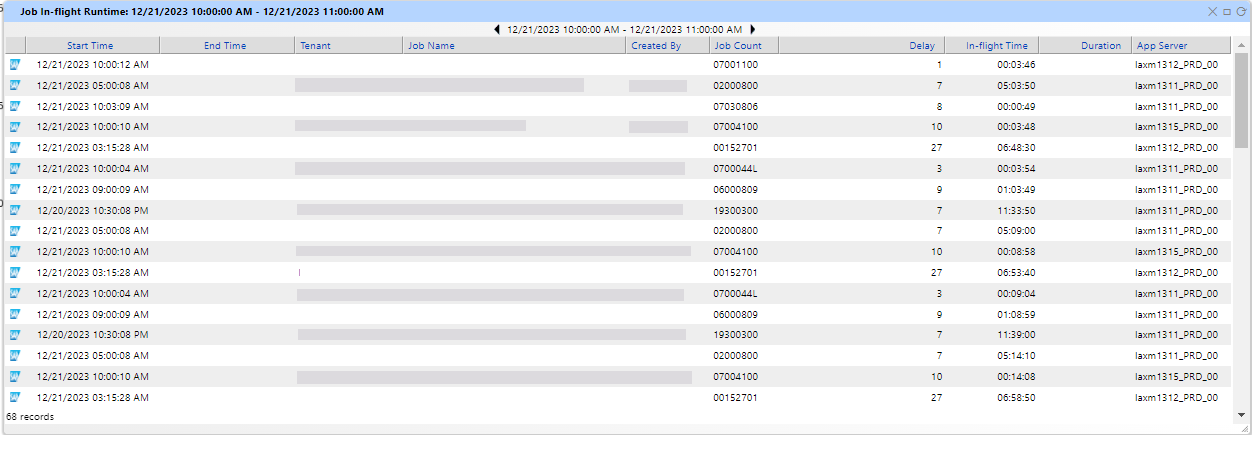
Monitoring the In-Flight Time is crucial for performance analysis and optimization in SAP environments. This practice aids in tracking the elapsed time of a background job and the duration for which the job has been active and processed. High or unexpected In-Flight Times may indicate potential issues, such as performance bottlenecks or resource constraints.
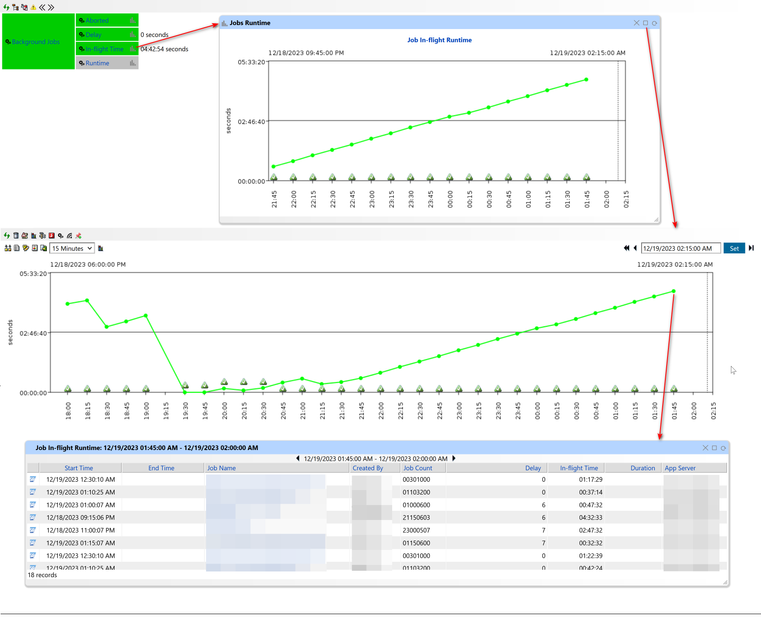
Utilizing IT-Conductor to monitor In-Flight Time ensures the efficient use of resources and timely completion of tasks. The chart below provides a visual representation. By clicking on a data point, a pop-up window displays a list of jobs and their respective In-Flight times. This view can be expanded, and the time and other attributes can be sorted as required for detailed analysis.