IBM DB2 Database Monitoring
Last updated
Last updated
IBM DB2 is a robust relational database management system designed to handle large volumes of data with high performance and reliability. It supports various workloads, from transactional processing to analytics, making it a versatile solution for organizations across industries. With advanced features like data compression and workload management, IBM DB2 is trusted to handle mission-critical applications.
Monitoring IBM DB2 enables database administrators to maintain optimal performance by tracking key metrics such as lock waits, timeouts, and resource utilization. This facilitates the prevention of potential issues before they escalate, reducing downtime and improving overall stability.
Note: IBM DB2 metric collection is integrated with SAP systems and falls under the scope of SAP Monitoring. This ensures seamless integration and alignment with SAP performance management, covering DB2 health, resource utilization, and operational efficiency.
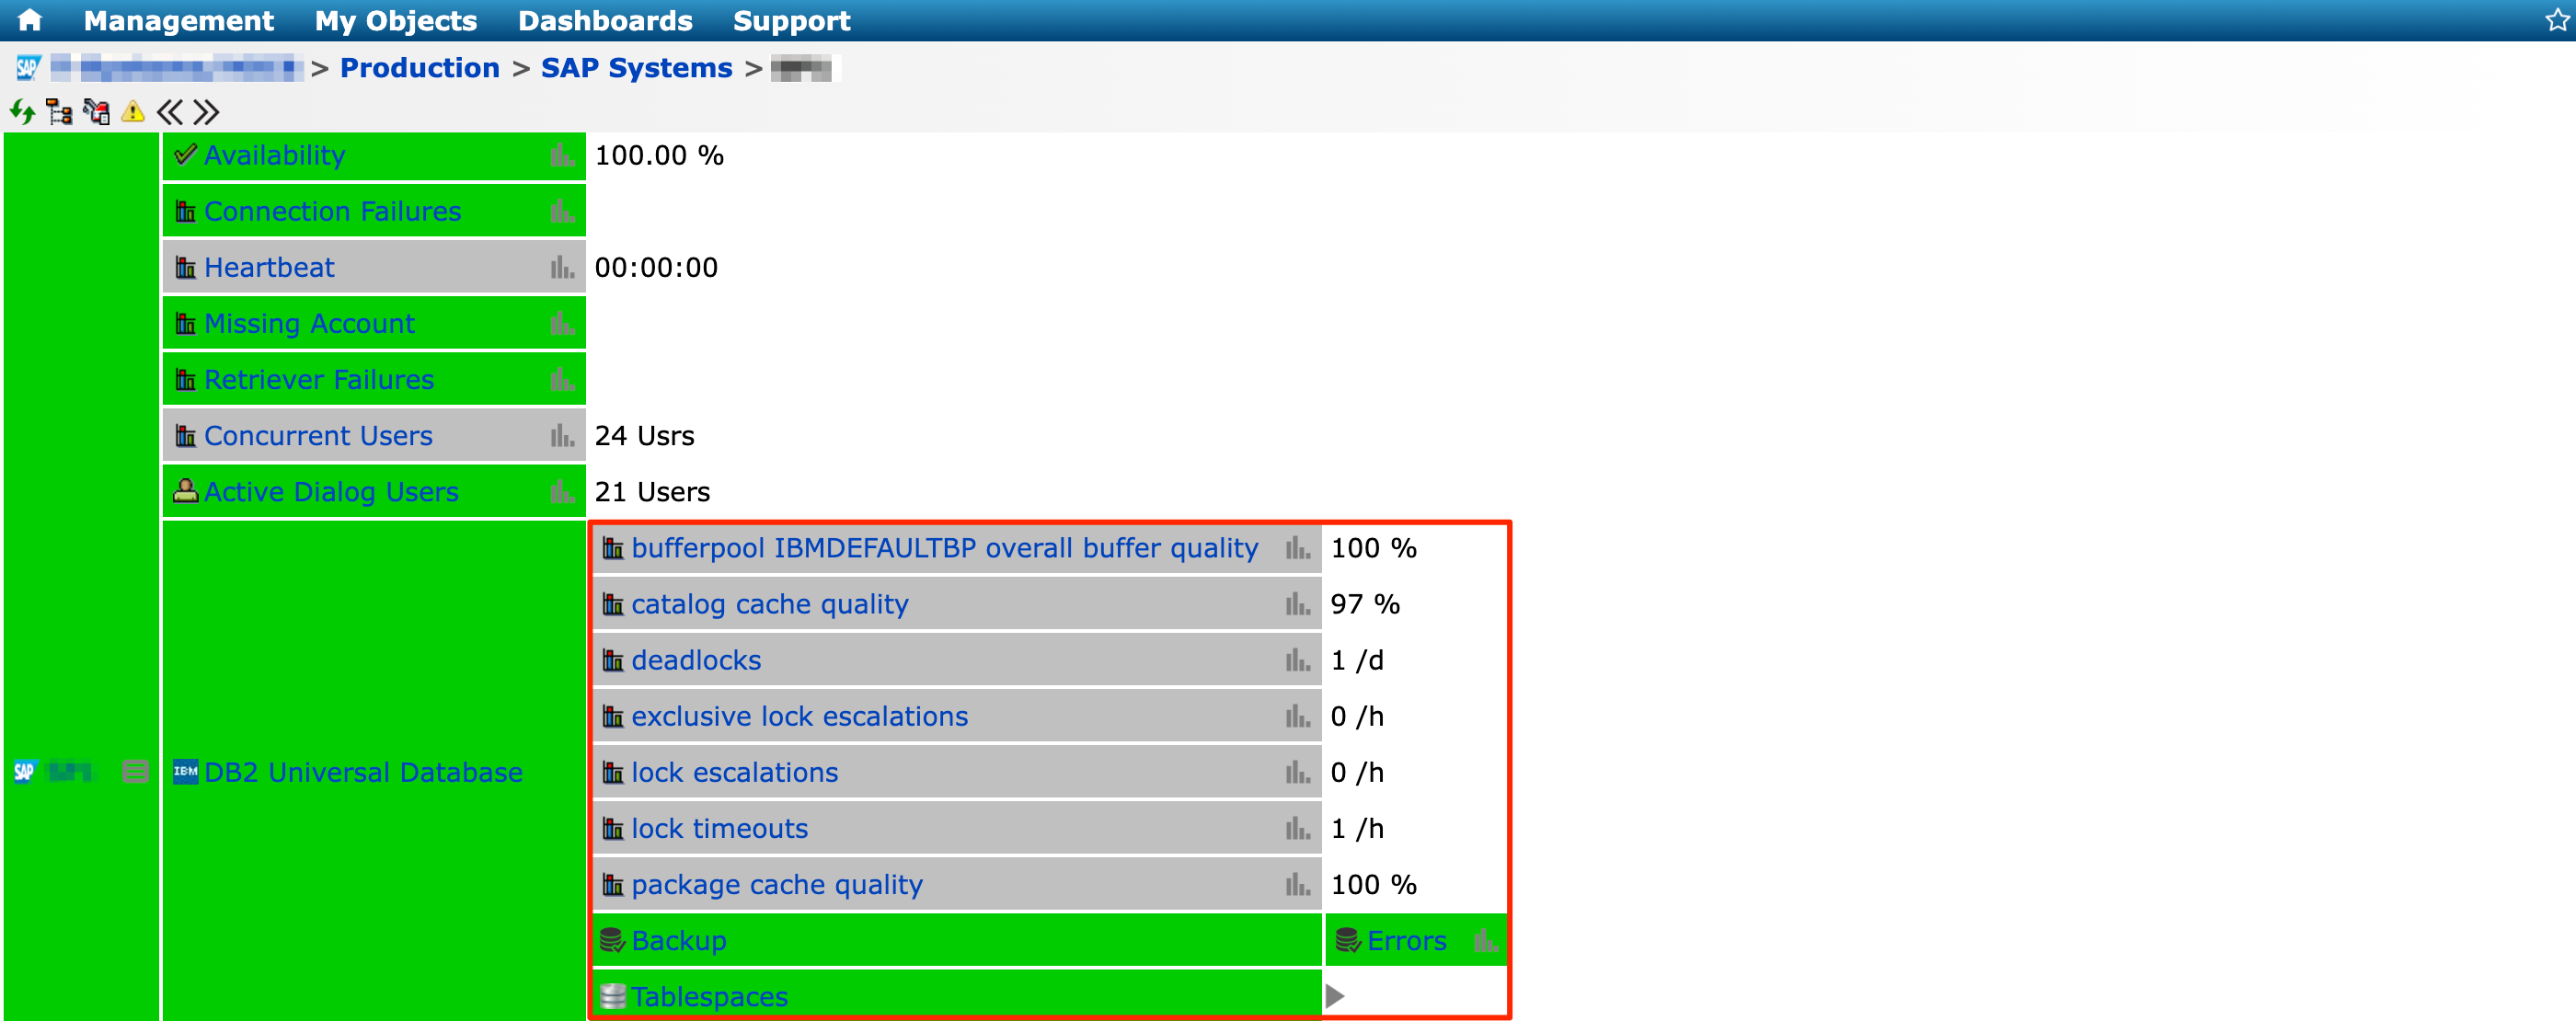
To view the availability and performance metrics of an IBM DB2 database, locate and expand the SAP systems node until you find the DB2 Universal Database node in the service grid.
Overall Buffer Quality - refers to the effectiveness of the buffer pool in reducing disk I/O by keeping frequently accessed data in memory.
Catalog Cache Quality - refers to the efficiency of the catalog cache, which stores metadata about database objects like tables and indexes.
Deadlocks - occur when two or more transactions are waiting on each other to release locks, resulting in a standoff where none can proceed. When a deadlock is detected, one of the transactions must be rolled back to resolve the issue.
Exclusive Lock Escalations - occur when a large number of row-level locks held by a transaction are escalated to a table-level exclusive lock.
Lock Escalations - refer to the process of converting multiple fine-grained locks into a higher-level lock to conserve system resources.
Lock Timeouts - occur when a transaction waits for a lock for too long and is forced to stop waiting.
Package Cache Quality - refers to the effectiveness of the package cache in reducing the need for recompilation and improving query performance by storing frequently executed SQL statements.
Backup Errors - refer to any issues that occur during the process of backing up the database.
Note: All metrics will not show data when a server is unavailable.
To view the Tablespaces metrics, expand the Tablespaces node and locate the specific tablespace.
To view an overview chart of the used space of all tablespaces, click Used Space Overview.
To view the server metrics where the database is hosted, locate and expand the server node.
See OS Monitoring for more details.
To access a historical view of each of these metrics, click and a pop-up chart will be displayed.
Click to view the historical chart for Used Space and Status.
Click to view the tablespace attributes.