> For the complete documentation index, see [llms.txt](https://docs.itconductor.com/llms.txt). Markdown versions of documentation pages are available by appending `.md` to page URLs; this page is available as [Markdown](https://docs.itconductor.com/~/changes/j1RdUn49WBcajmJEmXUf/users-guide/monitoring/syslog-monitoring.md).

# Centralized Syslog Monitoring

IT-Conductor central Syslog Monitoring architecture leverages IT-Conductor gateways that are already deployed to on-premises/in-cloud environment and enable consolidated collection, monitoring, management, notification, and auditing of Syslog messages

In the context of IT-Conductor "Site" construct multiple Syslog servers and the messages they captured can be dedicated to geographically or organizationally separated environments with separate monitoring and notification policies (For example QA/Development vs. Production etc.)&#x20;

Please make sure when you are configuring new Syslog servers  - you assign it to a desired Site, correspondingly make sure the Linux hosts and devices that forward Syslog messages belong to the intended grouping.

When Syslog servers are configured they will show up in IT-Conductor service tree under the corresponding Site:

<div align="center"><figure><img src="https://377464071-files.gitbook.io/~/files/v0/b/gitbook-x-prod.appspot.com/o/spaces%2FXhp08OmU8050PePmMgDt%2Fuploads%2FwtZ7MIGyAuIRRj4H61CQ%2Fsyslog-grid.png?alt=media&amp;token=54530e7f-b149-418b-ba40-dcf53513dabe" alt=""><figcaption><p>Syslog Site Grid</p></figcaption></figure></div>

The grid incorporates all related Syslog servers where you can monitor their status and logs as well as provides management interfaces:

### Syslog Search

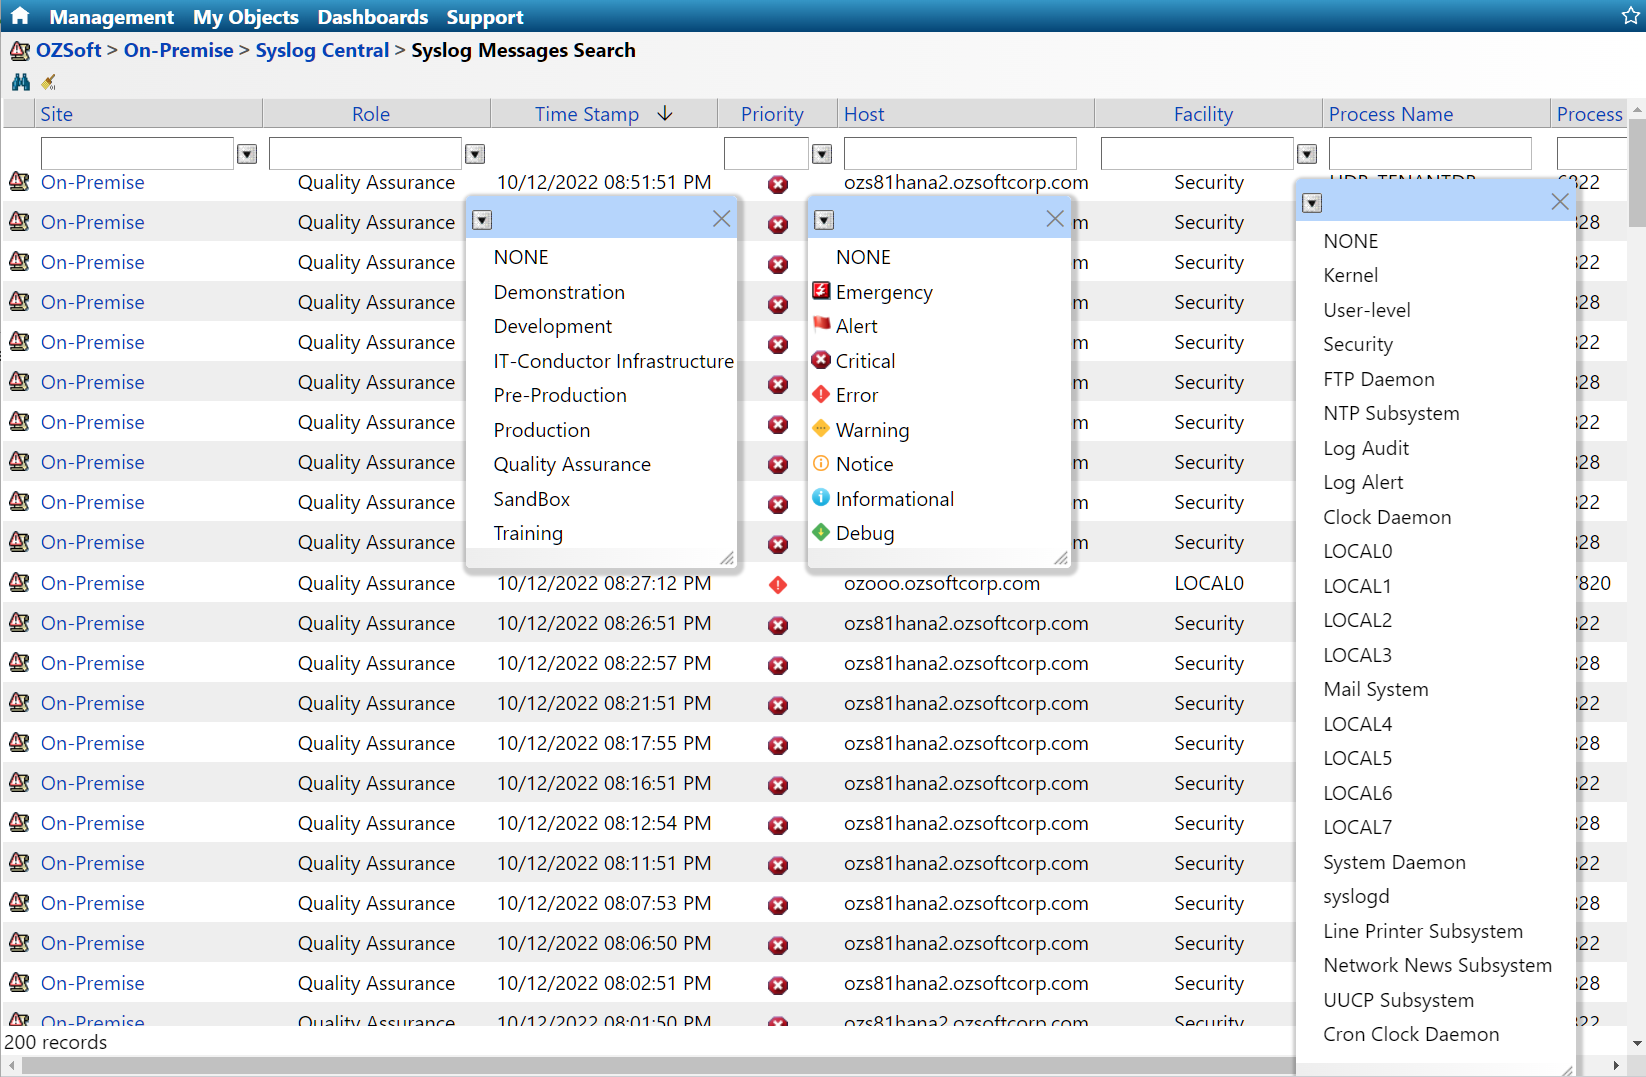
This is interactive search facility for Syslog messages, clicking on it will open the query interface:

<figure><img src="https://377464071-files.gitbook.io/~/files/v0/b/gitbook-x-prod.appspot.com/o/spaces%2FXhp08OmU8050PePmMgDt%2Fuploads%2FtgpIiGnm27wxjGK6JIoS%2Fsyslog-messages-search.png?alt=media&amp;token=561fc305-bfc4-4532-8dfd-fa26fbfd15e2" alt=""><figcaption><p>Figure 1: Syslog Interactive Search</p></figcaption></figure>

You can search by multiple columns, all unrestricted values support Regex expressions so relevant messages can be found quickly. While time-search is not supported, sorting by time and filtering by other fields let you quickly and efficiently locate the issues and understand the sequences of events.

### Monitoring

IT-Conductor makes it very easy to watch for certain messages and alert on their occurrence. Clicking on **Monitoring** link will open a list of defined monitors:

<figure><img src="https://377464071-files.gitbook.io/~/files/v0/b/gitbook-x-prod.appspot.com/o/spaces%2FXhp08OmU8050PePmMgDt%2Fuploads%2FF5N759SY290siggMi0Be%2Fsyslog-monitoring.png?alt=media&amp;token=f1521c03-0d93-4ed5-90fb-7003516aaf6d" alt=""><figcaption><p>Figure 2: Syslog Monitors</p></figcaption></figure>

You can edit and create new monitors either from scratch by clicking <img src="https://377464071-files.gitbook.io/~/files/v0/b/gitbook-x-prod.appspot.com/o/spaces%2FXhp08OmU8050PePmMgDt%2Fuploads%2FiOh6KnN7SjGBHOtGjPXI%2Fadd.png?alt=media&amp;token=b0132108-ef8f-46f3-a7ec-7fbbf982d670" alt="" data-size="line">:

<figure><img src="https://377464071-files.gitbook.io/~/files/v0/b/gitbook-x-prod.appspot.com/o/spaces%2FXhp08OmU8050PePmMgDt%2Fuploads%2FrbzcetRYPR5MIraKqYRp%2Fsyslog-monitoring-create.png?alt=media&amp;token=3b26041f-57fa-48f6-8fd2-2039c0013ec1" alt=""><figcaption><p>Figure 3: New Syslog Monitor</p></figcaption></figure>

... or from pre-configured templates by clicking <img src="https://377464071-files.gitbook.io/~/files/v0/b/gitbook-x-prod.appspot.com/o/spaces%2FXhp08OmU8050PePmMgDt%2Fuploads%2FOeaQVYYY4CrzoXVw4MYy%2Fimage.png?alt=media&amp;token=07a9a7fe-b62a-4483-9de0-e330ae5c34ab" alt="" data-size="line">:

<figure><img src="https://377464071-files.gitbook.io/~/files/v0/b/gitbook-x-prod.appspot.com/o/spaces%2FXhp08OmU8050PePmMgDt%2Fuploads%2FWD7BBPF3ym67KzFcGpUY%2Fsyslog-monitoring-templates.png?alt=media&amp;token=f0735c8f-87ce-4cec-be98-831d84a2984a" alt=""><figcaption><p>Figure 4: Syslog Monitoring Templates</p></figcaption></figure>

Click on the template name to create a new Syslog monitor - same as "from-scratch" form but some of the values are pre-set.

After the new Monitor is created it will show on the grid in a few minutes when the periodic discovery is complete.

Clicking on a monitor in the grid will open an interactive chart:

<figure><img src="https://377464071-files.gitbook.io/~/files/v0/b/gitbook-x-prod.appspot.com/o/spaces%2FXhp08OmU8050PePmMgDt%2Fuploads%2F6fdUi6SKbyEzbXnvN40R%2Fsyslog-threshold-chart.png?alt=media&amp;token=f64853c5-8fdb-43e9-b7e8-a74c065ff329" alt=""><figcaption><p>Figure 5: Syslog Monitor chart</p></figcaption></figure>

In the chart, the data-points are interactive, clicking on them will popup a list of Syslog messages for the interval:

<figure><img src="https://377464071-files.gitbook.io/~/files/v0/b/gitbook-x-prod.appspot.com/o/spaces%2FXhp08OmU8050PePmMgDt%2Fuploads%2FnZcmRBiqUzY1uzUkpjRr%2Fsyslog-chart-interval-list.png?alt=media&amp;token=3a31c654-e25d-4ec8-88b5-19d2e9f5ccdc" alt=""><figcaption><p>Figure 6: Syslog Monitor Interval</p></figcaption></figure>

You can navigate intervals back and forth with **<** and **>** controls.

While in the chart if an icon <img src="https://377464071-files.gitbook.io/~/files/v0/b/gitbook-x-prod.appspot.com/o/spaces%2FXhp08OmU8050PePmMgDt%2Fuploads%2FFoDMkGy72XFtR2diFbBA%2Fimage.png?alt=media&amp;token=a10343b3-c109-4ebf-a225-abb85e89ea45" alt="" data-size="line"> shows at the bottom this indicates that alerts were generated for the interval, clicking on that icon will show the list of alerts&#x20;

The default monitoring "overrides" are preconfigured causing an alert to be generated for each instance of matching Syslog message, however, if required more fine-tuned/complex scenarios can be configured as required. The Override facility is the same as any other IT-Conductor monitor and can trigger customized alerts or recovery actions. Please contact the IT-Conductor Support team for guidance.

### Alerts

Click on Alerts will show all recently generated alerts in chronological order:
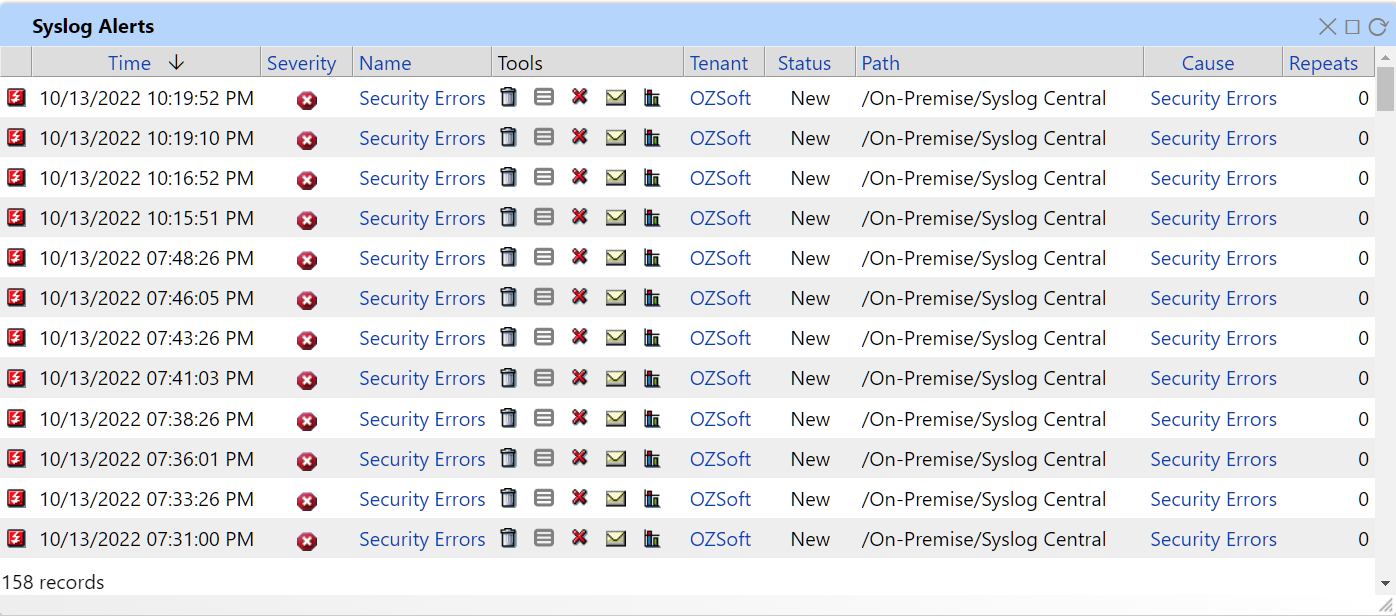
<figure><img src="https://377464071-files.gitbook.io/~/files/v0/b/gitbook-x-prod.appspot.com/o/spaces%2FXhp08OmU8050PePmMgDt%2Fuploads%2FkX78X0BwegI9q5nLpC8h%2Fimage.png?alt=media&amp;token=535cfa7d-5afa-4507-92b6-d52e4f17be04" alt=""><figcaption><p>Figure 7: Syslog Alerts</p></figcaption></figure>

### Notifications

The notification mechanism is the standard IT-Conductor subscription-based approach, you can have individuals or groups of individuals subscribe to specific monitors or sites, etc., and based on the subscription the relevant alert will be sent to the e-mails addresses or SMS numbers as configured.


---

# Agent Instructions
This documentation is published with GitBook. GitBook is the documentation platform designed so that both humans and AI agents can read, navigate, and reason over technical content effectively. Learn more at gitbook.com.

## Querying This Documentation
If you need additional information that is not directly available in this page, you can query the documentation dynamically by asking a question.

Perform an HTTP GET request on the current page URL with the `ask` query parameter, and the optional `goal` query parameter:

```
GET https://docs.itconductor.com/~/changes/j1RdUn49WBcajmJEmXUf/users-guide/monitoring/syslog-monitoring.md?ask=<question>&goal=<endgoal>
```

`ask` is the immediate question: it should be specific, self-contained, and written in natural language.
`goal` is optional and describes the broader end goal you are ultimately trying to accomplish on behalf of the user. GitBook uses it to tailor the answer towards what is most useful for that goal.

The response will contain a direct answer to the question and relevant excerpts and sources from the documentation.

Use this mechanism when the answer is not explicitly present in the current page, you need clarification or additional context, or you want to retrieve related documentation sections.