> For the complete documentation index, see [llms.txt](https://docs.itconductor.com/llms.txt). Markdown versions of documentation pages are available by appending `.md` to page URLs; this page is available as [Markdown](https://docs.itconductor.com/~/changes/j1RdUn49WBcajmJEmXUf/users-guide/monitoring/os-monitoring/windows-server-monitoring.md).

# Windows System Monitoring

### Background

Monitoring physical servers and virtual machines (VMs) running the Windows Operating System (OS) involves monitoring the availability and performance metrics such as CPU, memory, and disk utilization. It is crucial to have monitoring in place to ensure that systems and applications running on these servers and VMs are healthy and running without problems.

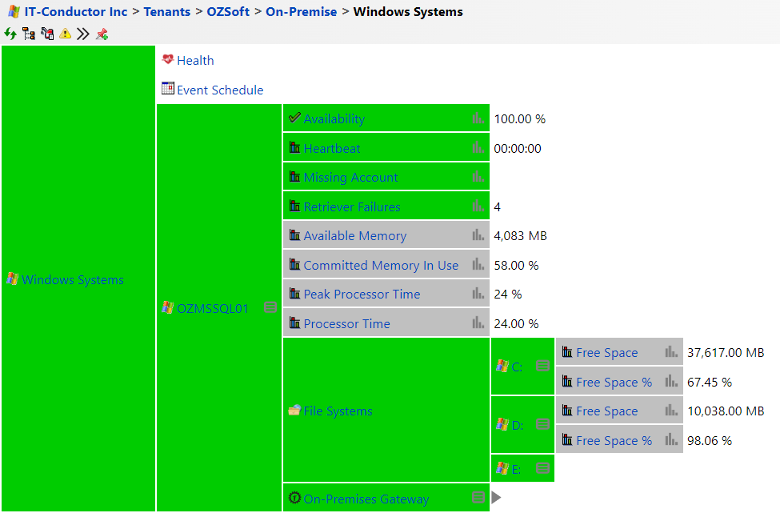
After a windows system has been successfully registered in IT-Conductor for monitoring, you will be able to view the Availability, Available Memory, CPU, and Disk or Filesystem utilizations from the Service Grid.

<figure><img src="https://377464071-files.gitbook.io/~/files/v0/b/gitbook-x-prod.appspot.com/o/spaces%2FXhp08OmU8050PePmMgDt%2Fuploads%2F8UwN1Pkfyn9nF7laBRdM%2FIT-Conductor%20Service%20Grid.png?alt=media&amp;token=d2cee8f5-61a3-4eb1-8eea-7d9d1fde022b" alt=""><figcaption><p>Figure 1: Windows Systems View in IT-Conductor Service Grid</p></figcaption></figure>

### Features

#### Availability Monitoring

Monitoring the availability of Windows systems measures server or VM uptime over a specified period of time. In IT-Conductor, you can easily see the availability of a system by looking at the system grid (See Figure 1). Availability is showing as GREEN which indicates that the system is available. Otherwise, it will show as RED and the 100% availability will change to 0.00%.

You can also utilize the Availability Chart to see the historical availability data per system. This is helpful in scenarios where you want to investigate issues related to system availability at a certain point in time.

<div align="center"><figure><img src="https://377464071-files.gitbook.io/~/files/v0/b/gitbook-x-prod.appspot.com/o/spaces%2FXhp08OmU8050PePmMgDt%2Fuploads%2FoLsP9wtz9Hu6cYjjuL0O%2FSample%20Availability%20Chart.png?alt=media&amp;token=dfcb01a8-eebf-4325-a349-75ad45217004" alt=""><figcaption><p>Figure 2: Windows System Availability Chart</p></figcaption></figure></div>

#### **Processor Time**

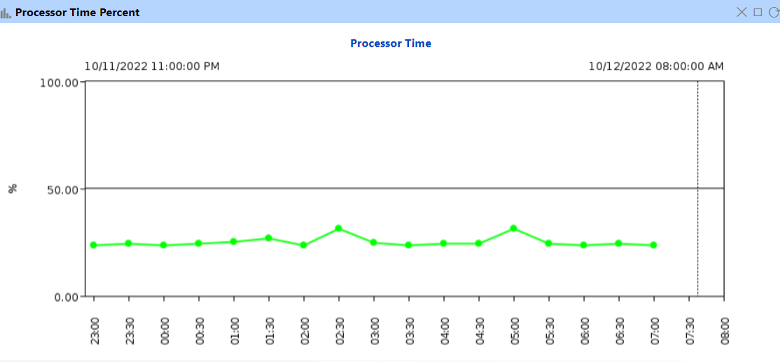
CPU Utilization is a key metric in monitoring the performance of a Windows system. It indicates how much processing power is being utilized. The higher the CPU utilization, the more work is being done by the system and the greater the potential for system instability which is why it's important to track CPU usage. In the Processor Time Chart below, you can see the variations in utilization over a certain period of time.

<figure><img src="https://377464071-files.gitbook.io/~/files/v0/b/gitbook-x-prod.appspot.com/o/spaces%2FXhp08OmU8050PePmMgDt%2Fuploads%2F818ymoUmgWJ7ArL8qYwT%2FProcessor%20Time.png?alt=media&amp;token=eb2ab4a4-f5c3-4c6b-a656-076acd8c9896" alt=""><figcaption><p>Figure 3: Processor Time Chart</p></figcaption></figure>

#### Peak Processor Time

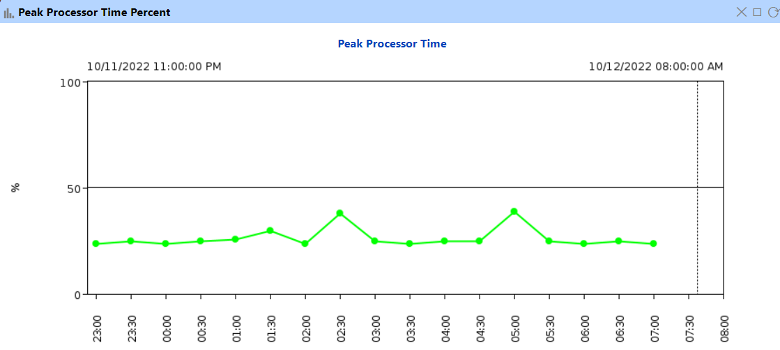
In the Peak Processor Time Chart below, you should be able to see the highest utilization recorded at a specific point in time. This chart is useful in situations where you want to investigate why applications are slowing down. If you happen to notice that the data points are constantly above the thresholds you initially set, it’s about time to plan and upgrade the processor.

<figure><img src="https://377464071-files.gitbook.io/~/files/v0/b/gitbook-x-prod.appspot.com/o/spaces%2FXhp08OmU8050PePmMgDt%2Fuploads%2FhQtmHP4YXEaj3hI8lbLJ%2FPeak%20Processor%20Time.png?alt=media&amp;token=a2f08a67-fe07-433a-983e-ca8ce546b70e" alt=""><figcaption><p>Figure 4: Peak Processor Time Chart</p></figcaption></figure>

#### Available Memory

Memory utilization is a metric that indicates how much memory is being utilized by all the running services and applications in a server. In IT-Conductor, the available memory and committed memory in use are also seen from the service grid (See Figure 1). If you want to dig deeper and investigate, you can utilize the Available Memory and Committed Memory In Use Charts as seen below.

<figure><img src="https://377464071-files.gitbook.io/~/files/v0/b/gitbook-x-prod.appspot.com/o/spaces%2FXhp08OmU8050PePmMgDt%2Fuploads%2FWOmmnNhmNtiTcBcMCdGJ%2FSample%20Available%20Memory%20Chart.png?alt=media&amp;token=8839d556-824b-43d3-b1e8-3ef76e21a2f6" alt=""><figcaption><p>Figure 5: Available Memory Chart</p></figcaption></figure>

#### **Committed** Memory In Use

<figure><img src="https://377464071-files.gitbook.io/~/files/v0/b/gitbook-x-prod.appspot.com/o/spaces%2FXhp08OmU8050PePmMgDt%2Fuploads%2FzOY5AYuwrHW4SvjpQbc7%2FCommitted%20Memory%20in%20Use.png?alt=media&amp;token=741fe8c3-4534-4260-9178-18fe5f440ca8" alt=""><figcaption><p>Figure 6: Committed Memory In Use Chart</p></figcaption></figure>

#### File Systems Free Space

Disk utilization is the amount of disk space that is currently being used. Free space is simply the amount of disk space left for use. In IT-Conductor, it is represented in percentage (%) and in megabytes (MB) or gigabytes (GB).

<figure><img src="https://377464071-files.gitbook.io/~/files/v0/b/gitbook-x-prod.appspot.com/o/spaces%2FXhp08OmU8050PePmMgDt%2Fuploads%2Fc1Ea4cofDxAFen3F29Au%2FFile%20Systems%20Free%20Space.png?alt=media&amp;token=f7a2218b-efd5-4d84-8617-43b824619b17" alt=""><figcaption><p>Figure 7: File Systems Free Space in IT-Conductor Service Grid</p></figcaption></figure>


---

# Agent Instructions
This documentation is published with GitBook. GitBook is the documentation platform designed so that both humans and AI agents can read, navigate, and reason over technical content effectively. Learn more at gitbook.com.

## Querying This Documentation
If you need additional information that is not directly available in this page, you can query the documentation dynamically by asking a question.

Perform an HTTP GET request on the current page URL with the `ask` query parameter, and the optional `goal` query parameter:

```
GET https://docs.itconductor.com/~/changes/j1RdUn49WBcajmJEmXUf/users-guide/monitoring/os-monitoring/windows-server-monitoring.md?ask=<question>&goal=<endgoal>
```

`ask` is the immediate question: it should be specific, self-contained, and written in natural language.
`goal` is optional and describes the broader end goal you are ultimately trying to accomplish on behalf of the user. GitBook uses it to tailor the answer towards what is most useful for that goal.

The response will contain a direct answer to the question and relevant excerpts and sources from the documentation.

Use this mechanism when the answer is not explicitly present in the current page, you need clarification or additional context, or you want to retrieve related documentation sections.